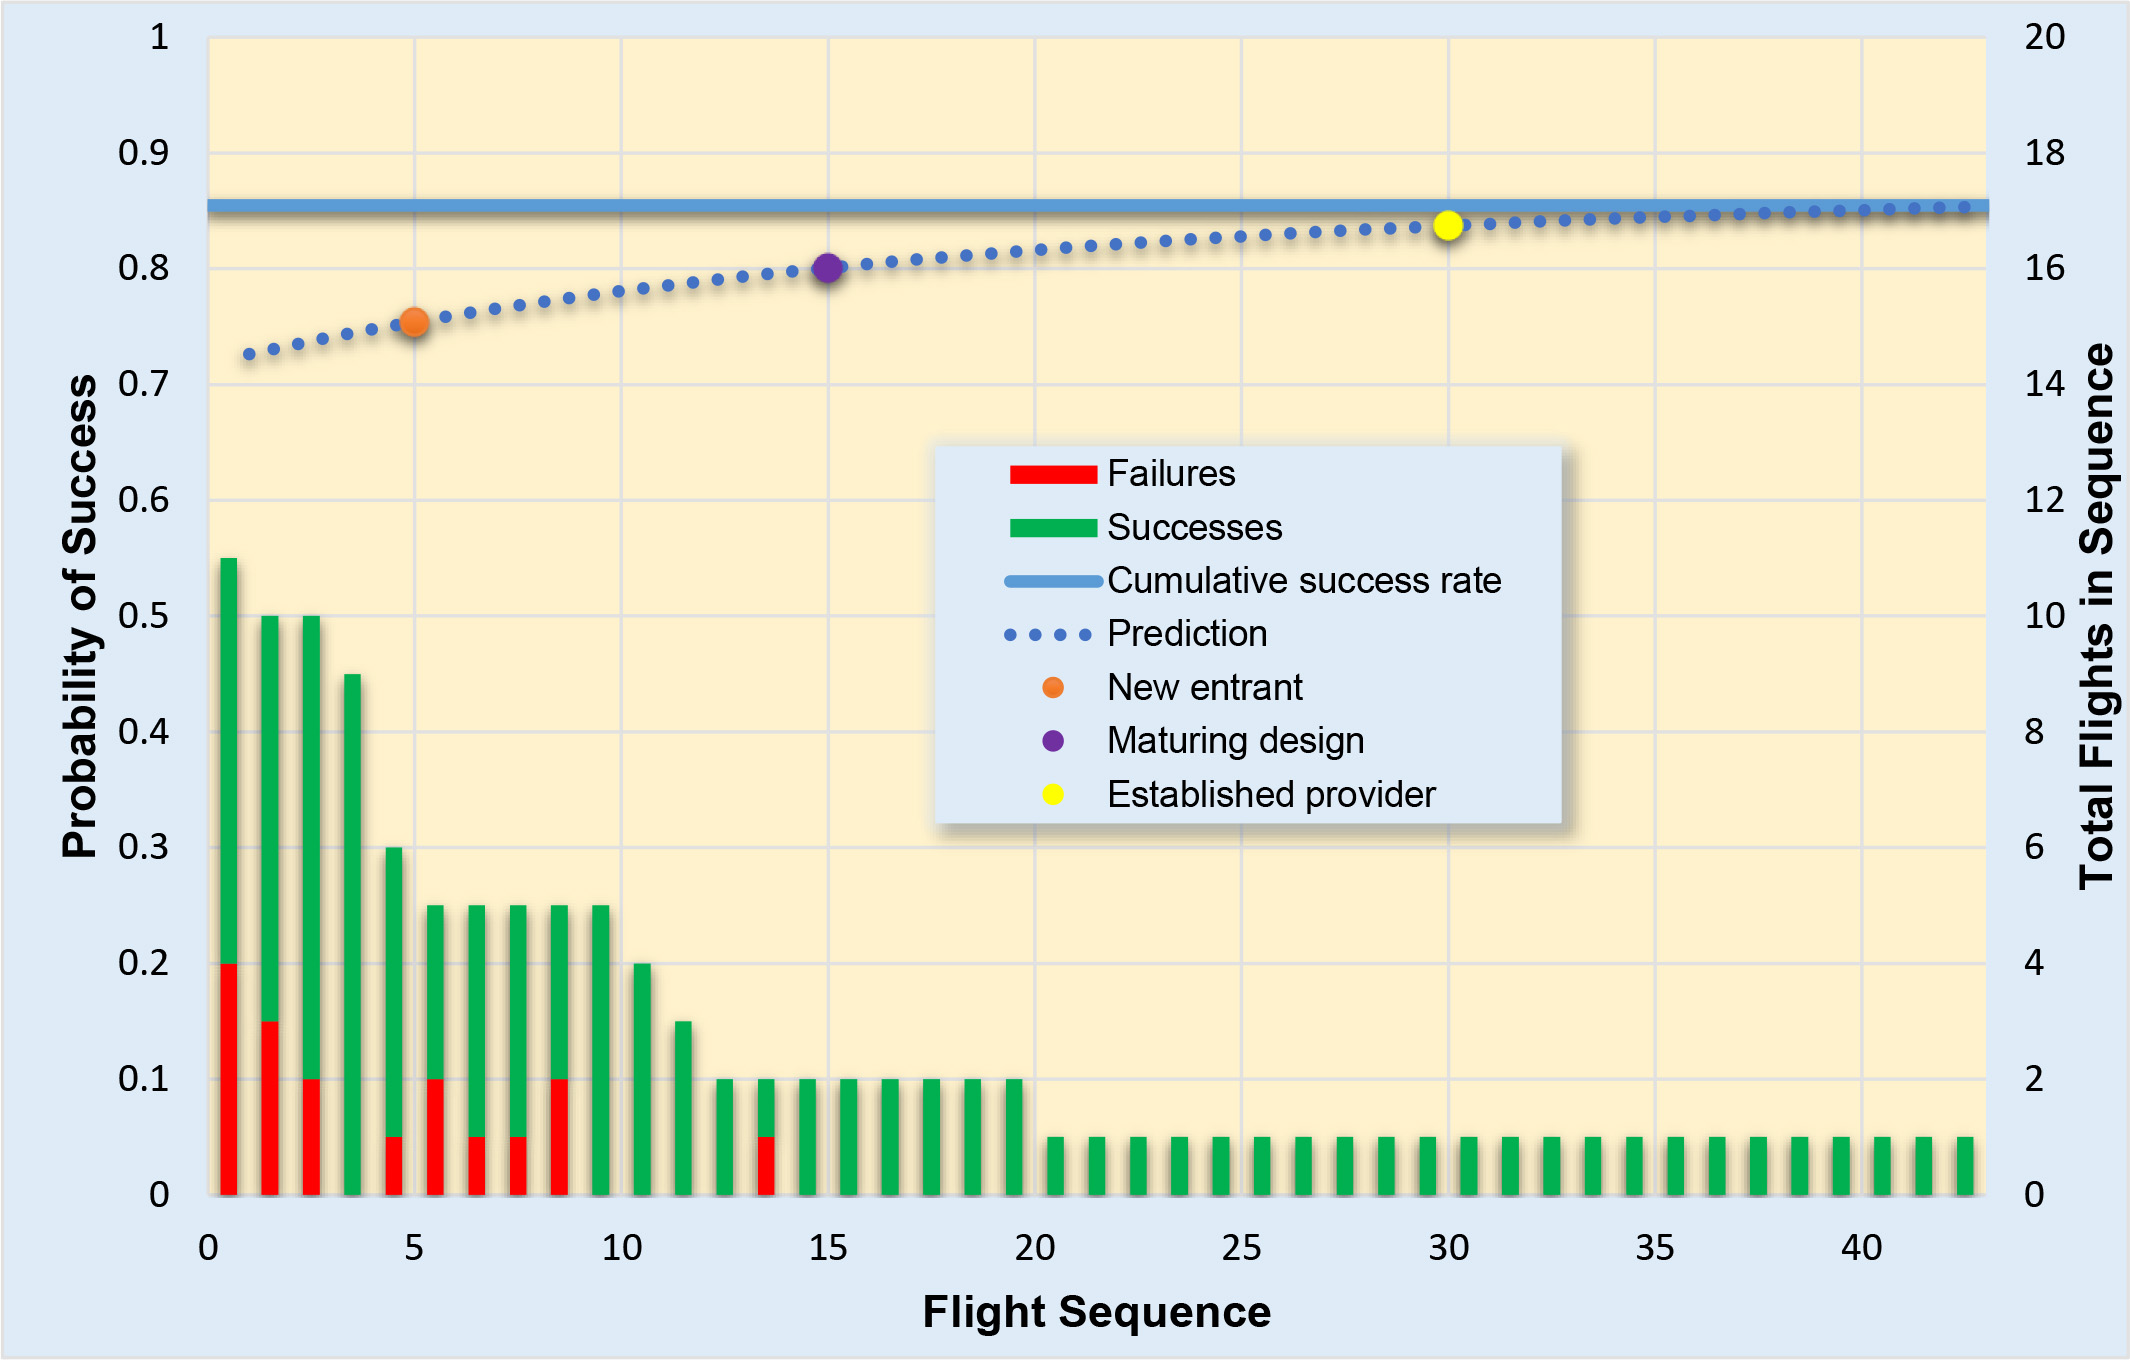
The Aerospace Corporation (Aerospace) periodically generates predictions of the probability of mission success (aka reliability) for upcoming national security space launches, using reliability models based on the success and failure history of over 800 U.S. European launch missions. These predictions are a vital input to forward-looking studies such as functional availability analyses and constellation risk assessments, tools that mission planners utilize to ensure high confidence in enduring constellation success.
The predictions are based on the reliability growth principle, which is the continuous improvement in reliability as a system is operated or tested and as/or process defects are discovered and corrected. Analysis of historical launch data, maintained in the Acquisition Support and Systems Engineering Tool (ASSET), shows that reliability growth is one of the most significant factors affecting launch reliability—the more experience behind a launch vehicle family, the more reliable future launches are expected to be.
Another factor affecting launch reliability is payload capacity. Historically, medium-class vehicles like the Atlas V, Delta IV, and Falcon 9 have been the most reliable launch vehicles. Heavy-class and small-class vehicles have not fared as well. To account for these differences, Aerospace generates separate data-driven predictions for all three classes of vehicles.

For example, the first bar on the left shows 11 small launch vehicles on their first flight: four and seven succeeded. As the number of flights increases, the total number of flights in the sequence decreases, as some launch vehicle families have a more extensive history than others. Only one vehicle family has flown more than 20 flights. As the number of flights increases and less data is available, the growth model predictions become more uncertain.
The launch vehicle landscape is a dynamic environment, with many new entrant providers and customers. Aerospace continually updates this analysis with the latest launch to provide our customers with the best possible estimates of the probability of launch mission success to inform their acquisition decisions.
REFERENCE
Launch Vehicle Mission Success by Michael Moore, TOR-2019-01315, The Aerospace Corporation.
This story appears in the June 2019 issue of Getting It Right, Collaborating for Mission Success.
Subscribe to Getting It Right


